HDFC Banking & Financial Services Fund - Growth Option
(Erstwhile HDFC Banking and Financial Services Fund - Growth Option)
| Category: Equity: Sectoral-Banking and Financial Services |
| Launch Date: 01-07-2021 |
| Asset Class: |
| Benchmark: NIFTY Financial Services TRI |
| Expense Ratio: 1.91% As on (29-09-2025) |
| Status: Open Ended Schemes |
| Minimum Investment: 100.0 |
| Minimum Topup: 100.0 |
| Total Assets: 413.49 Cr As on (30-09-2025) |
| Turn over: 23.41% |
17.609
-0.06 (-0.3635%)
14.14%
NIFTY Financial Services TRI 0.08%
PERFORMANCE of HDFC Banking & Financial Services Fund - Growth Option
Scheme Performance (%)
Data as on - 04-11-2025Yearly Performance (%)
Fund Managers
FM 1 - Mr.Anand Laddha, FM 2 - Mr. Dhruv Muchhal
Investment Objective
The scheme seeks to provide long-term capital appreciation by investing predominantly in equity and equity related instruments of companies engaged in banking and financial services.
MONTHLY LUMPSUM RETURNS ( Invested amount 1,00,000)
| NAV Date | NAV | Units | Market Value |
Returns (%) |
|---|---|---|---|---|
| 01-07-2021 | 9.91 | 10090.8174 | 100000 | 0.0 % |
| 02-08-2021 | 9.947 | 10090.8174 | 100373 | 0.37 % |
| 01-09-2021 | 10.592 | 10090.8174 | 106882 | 6.88 % |
| 01-10-2021 | 10.585 | 10090.8174 | 106811 | 6.81 % |
| 01-11-2021 | 11.147 | 10090.8174 | 112482 | 12.48 % |
| 01-12-2021 | 10.345 | 10090.8174 | 104390 | 4.39 % |
| 03-01-2022 | 10.299 | 10090.8174 | 103925 | 3.92 % |
| 01-02-2022 | 10.589 | 10090.8174 | 106852 | 6.85 % |
| 02-03-2022 | 9.671 | 10090.8174 | 97588 | -2.41 % |
| 01-04-2022 | 10.259 | 10090.8174 | 103522 | 3.52 % |
| 02-05-2022 | 9.891 | 10090.8174 | 99808 | -0.19 % |
| 01-06-2022 | 9.663 | 10090.8174 | 97508 | -2.49 % |
| 01-07-2022 | 9.194 | 10090.8174 | 92775 | -7.22 % |
| 01-08-2022 | 10.357 | 10090.8174 | 104511 | 4.51 % |
| 01-09-2022 | 10.679 | 10090.8174 | 107760 | 7.76 % |
| 03-10-2022 | 10.235 | 10090.8174 | 103280 | 3.28 % |
| 01-11-2022 | 11.005 | 10090.8174 | 111049 | 11.05 % |
| 01-12-2022 | 11.599 | 10090.8174 | 117043 | 17.04 % |
| 02-01-2023 | 11.661 | 10090.8174 | 117669 | 17.67 % |
| 01-02-2023 | 10.938 | 10090.8174 | 110373 | 10.37 % |
| 01-03-2023 | 11.01 | 10090.8174 | 111100 | 11.1 % |
| 03-04-2023 | 11.02 | 10090.8174 | 111201 | 11.2 % |
| 02-05-2023 | 11.574 | 10090.8174 | 116791 | 16.79 % |
| 01-06-2023 | 11.93 | 10090.8174 | 120383 | 20.38 % |
| 03-07-2023 | 12.697 | 10090.8174 | 128123 | 28.12 % |
| 01-08-2023 | 12.791 | 10090.8174 | 129072 | 29.07 % |
| 01-09-2023 | 12.684 | 10090.8174 | 127992 | 27.99 % |
| 03-10-2023 | 12.762 | 10090.8174 | 128779 | 28.78 % |
| 01-11-2023 | 12.538 | 10090.8174 | 126519 | 26.52 % |
| 01-12-2023 | 13.414 | 10090.8174 | 135358 | 35.36 % |
| 01-01-2024 | 14.113 | 10090.8174 | 142412 | 42.41 % |
| 01-02-2024 | 13.883 | 10090.8174 | 140091 | 40.09 % |
| 01-03-2024 | 14.127 | 10090.8174 | 142553 | 42.55 % |
| 01-04-2024 | 14.094 | 10090.8174 | 142220 | 42.22 % |
| 02-05-2024 | 14.741 | 10090.8174 | 148749 | 48.75 % |
| 03-06-2024 | 15.082 | 10090.8174 | 152190 | 52.19 % |
| 01-07-2024 | 15.831 | 10090.8174 | 159748 | 59.75 % |
| 01-08-2024 | 15.584 | 10090.8174 | 157255 | 57.26 % |
| 02-09-2024 | 15.818 | 10090.8174 | 159617 | 59.62 % |
| 01-10-2024 | 16.302 | 10090.8174 | 164501 | 64.5 % |
| 04-11-2024 | 15.573 | 10090.8174 | 157144 | 57.14 % |
| 02-12-2024 | 15.669 | 10090.8174 | 158113 | 58.11 % |
| 01-01-2025 | 15.574 | 10090.8174 | 157154 | 57.15 % |
| 03-02-2025 | 14.914 | 10090.8174 | 150494 | 50.49 % |
| 03-03-2025 | 14.369 | 10090.8174 | 144995 | 45.0 % |
| 01-04-2025 | 15.165 | 10090.8174 | 153027 | 53.03 % |
| 02-05-2025 | 16.39 | 10090.8174 | 165388 | 65.39 % |
| 02-06-2025 | 16.871 | 10090.8174 | 170242 | 70.24 % |
| 01-07-2025 | 17.518 | 10090.8174 | 176771 | 76.77 % |
| 01-08-2025 | 16.705 | 10090.8174 | 168567 | 68.57 % |
| 01-09-2025 | 16.356 | 10090.8174 | 165045 | 65.05 % |
| 01-10-2025 | 16.833 | 10090.8174 | 169859 | 69.86 % |
| 03-11-2025 | 17.673 | 10090.8174 | 178335 | 78.33 % |
| 04-11-2025 | 17.609 | 10090.8174 | 177689 | 77.69 % |
RETURNS CALCULATOR for HDFC Banking & Financial Services Fund - Growth Option
Growth of 10000 In SIP (Fund vs Benchmark)
Growth of 10000 In LUMPSUM (Fund vs Benchmark)
Rolling Returns
Rolling returns are the annualized returns of the scheme taken for a specified period (rolling returns period) on every day/week/month and taken till the last day of the duration. In this chart we are showing the annualized returns over the rolling returns period on every day from the start date and comparing it with the benchmark. Rolling returns is the best measure of a fund's performance. Trailing returns have a recency bias and point to point returns are specific to the period in consideration. Rolling returns, on the other hand, measures the fund's absolute and relative performance across all timescales, without bias.
Market Cap Distribution
Small Cap
17.21%
Others
2.56%
Large Cap
68.4%
Mid Cap
11.83%
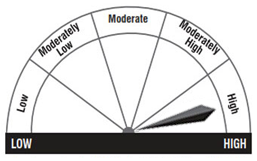
Riskometer
Key Performance and Risk Statistics of HDFC Banking & Financial Services Fund - Growth Option
| Key Statistics | Volatility | Sharpe Ratio | Alpha | Beta | Yield to Maturity | Average Maturity |
|---|---|---|---|---|---|---|
| HDFC Banking & Financial Services Fund - Growth Option | 18.15 | 0.85 | 1.9 | 0.93 | - | - |
| Equity: Sectoral-Banking and Financial Services | - | - | - | - | - | - |
PEER COMPARISION of HDFC Banking & Financial Services Fund - Growth Option
PORTFOLIO ANALYSIS of HDFC Banking & Financial Services Fund - Growth Option
Asset Allocation (%)
| Allocation | Percentage (%) |
|---|